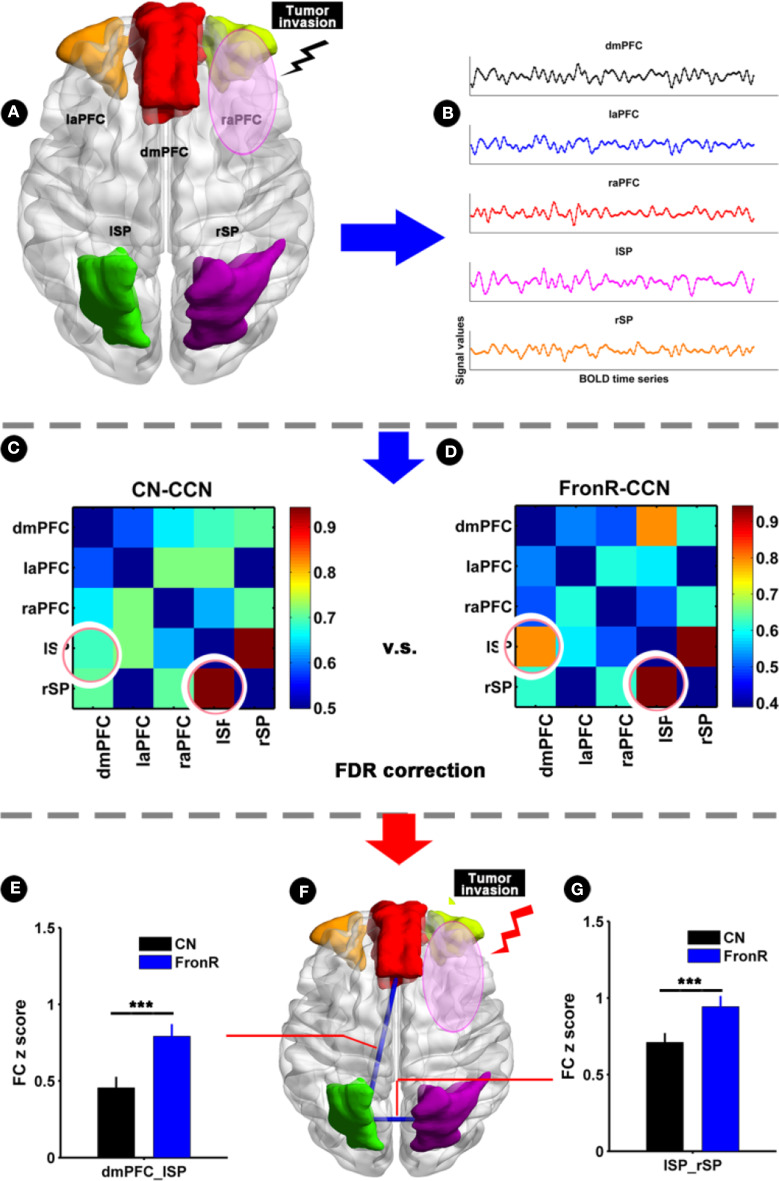
Figure 4.
Functional connectivity within CCN comparing FronR patients with CNs. Histograms and FC matrices within the CCN in tumors invading the right frontal lobe compared to CNs. (A) Shows five nodes within the CCN in tumors invading the right frontal lobe. (B) Shows a schematic diagram of the BOLD time series extracted from five nodes within the CCN. (C,D) show the mean FC matrices within the CCN in the CN and FronR groups, respectively. The FC z scores of between-group comparison are presented as mean ± SD in (E,G). (F) Shows altered FCs in the CCN of tumors invading the right frontal lobe compared to the CNs. ***FC results were considered statistically significant at P < 0.05 (FDR correction for multiple comparisons). DmPFC, dorsal mPFC (similar to superior medial frontal gyrus in AAL template); laPFC, left anterior PFC; raPFC, right anterior PFC; lSP, left superior parietal lobe; rSP, right superior parietal lobe; CN, controls; FrontR, patients with right frontal glioma; FC, functional connectivity; lSP-rSP, functional connectivity between lSP and rSP; dmPFC-lSP, functional connectivity between dorsal mPFC and lSP.

