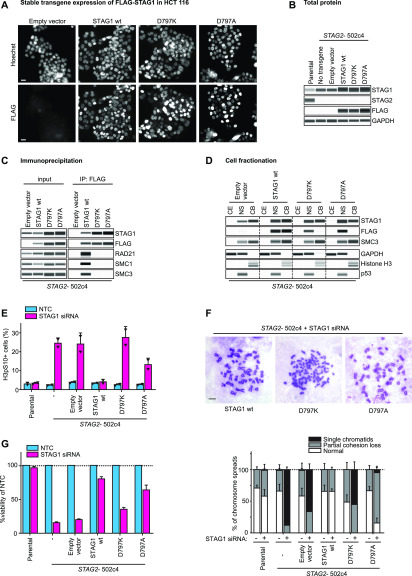
Figure 4. STAG1 D797 residue is essential for binding to the cohesin ring, chromatin localization, sister chromatid cohesion, and cell viability in STAG2-deficient cells.
(A) HCT 116 STAG2-502c4 cells were stably transduced with FLAG-tagged, siRNA-resistant wild-type (wt) and mutant STAG1 or empty vector control transgenes, and nuclear expression was assessed by FLAG immunofluorescence. Scale bar: 20 μm. (B) Capillary immunodetection assay was used to detect FLAG–STAG1 protein levels (see Fig S6A for quantifications). (C) Protein extracts from stably expressing FLAG–STAG1 wild-type and mutant cells were subjected to FLAG immunoprecipitation and analyzed for co-precipitation of cohesin ring members by capillary immunodetection assay (see Fig S6B for quantifications). (D) Cytoplasmic extract (CE), nuclear-soluble (NS), and chromatin-bound (CB) fractions were obtained to determine the subcellular distribution of FLAG–STAG1 wild-type and mutant protein by capillary immunodetection assay (for quantifications, see Fig S6C). (E) HCT 116 cells were transfected with nontarget control (NTC) and STAG1 siRNA duplexes, and immunofluorescence analysis was performed 72 h after transfection to determine the mitotic index by scoring the fraction of histone H3 phosphoSer10-positive (H3pS10+) cells (n ≥ 437 cells, triangles denote values of two independent experiments and error bars denote SD). (F) Prometaphase chromosome spreads were prepared 72 h after transfection of cells with NTC control or STAG1 siRNA duplexes. The status of sister chromatid cohesion of individual Giemsa spreads was categorized into normal, partial loss of cohesion, or single chromatid phenotypes (n = 100 spreads, error bars denote SD of two independent experiments with each two technical replicates). Scale bar: 10 μm. (G) Cell viability was assessed 5–6 d after siRNA transfection using a metabolic assay, and viability was normalized to NTC control (n = 4 biological repeats, error bars denote SD).
Source data are available for this figure.

