
FIGURE 1.
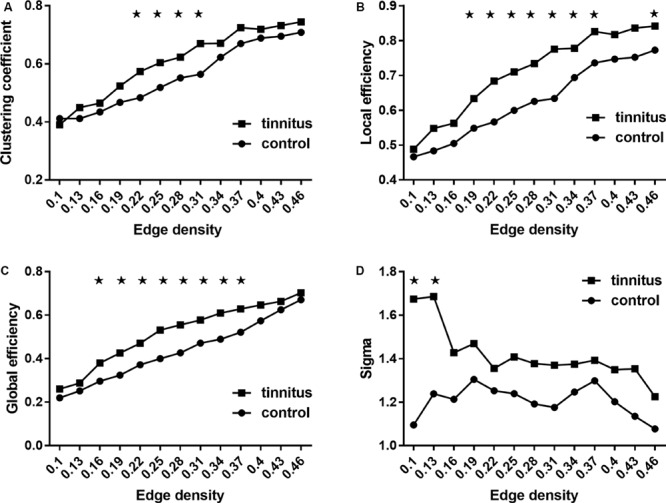
Between-group comparisons of global network measures. (A) Clustering coefficient, (B) local efficiency, (C) global efficiency, and (D) small-world property (sigma). (A–C) Increased as the network density increases, and (D) decreases as the network density increases. ★ Represents significant values. Results shown were thresholded at p < 0.001, corrected for multiple comparisons using the FDR procedure.