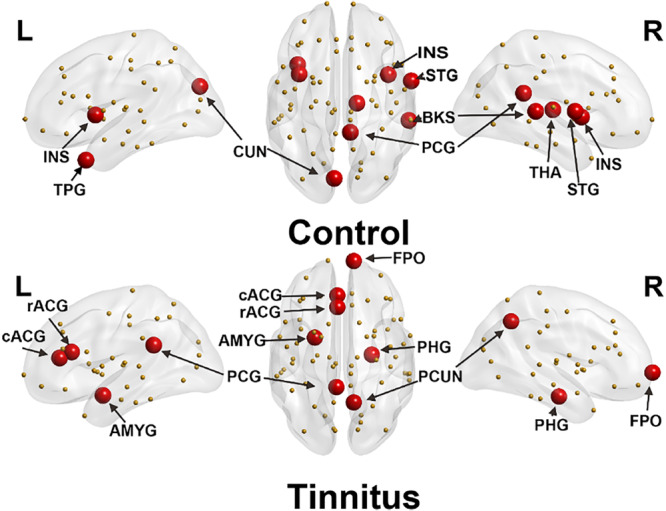
FIGURE 2.

Distribution of hub regions of control (upper panel) and tinnitus (lower panel) based on regional betweenness centrality (mean + 1.5 SD). Large red spheres represent brain hubs and small yellow spheres represent non-hub brain regions. INS, insula; TPG, temporal pole; CUN, cuneus; STG, superior temporal gyrus; PCG, posterior cingulate gyrus; BKS, bankssts; THA, thalamus; rACG, rostral anterior cingulate gyrus; cACG, caudal anterior cingulate gyrus; AMYG, amygdala; PHG, parahippocampus; PCUN, precuneus; FPO, frontal pole; L, left hemisphere; R, right hemisphere.
