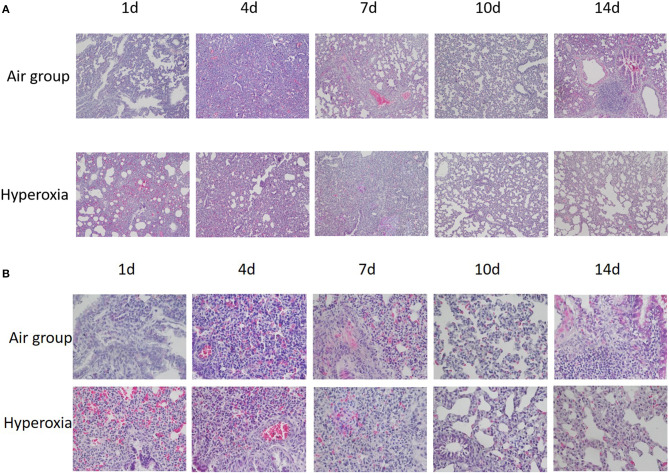
Figure 4.
(A) HE staining of lung tissue at different time in two groups (×100). (B) HE staining of lung tissue at different time in two groups (×400). When HE stained lung tissue was placed under 100 and 400 times light microscope, it can be seen that compared with the air group, the alveoli in the hyperoxia group lost their normal regular shape and structure disorder, the alveoli space became thinner, the alveoli cavity increased, and the number of alveoli decreased, especially at 10 and 14d.

