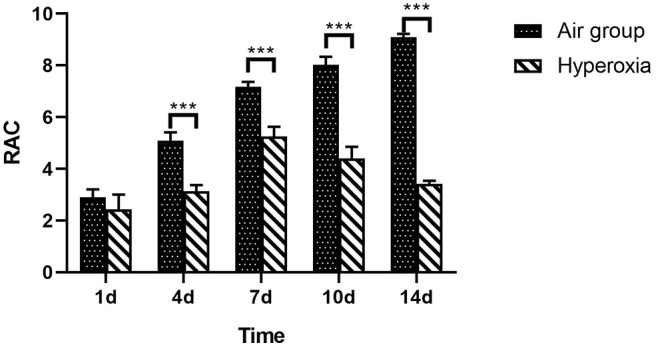
Figure 5.

RAC of lung tissue in two groups at different time points. From the center of respiratory bronchioles to the nearest pleura or fibrous septum, a vertical line is drawn. The number of alveoli on this line is the RAC, which reflects the development of alveoli. Compare with the air group, the RAC of hyperoxia group was significantly lower than that of the air group (p < 0.05). The RAC of the air group increased while the hyperoxia group decreased gradually after 7 days. ***p < 0.001.
