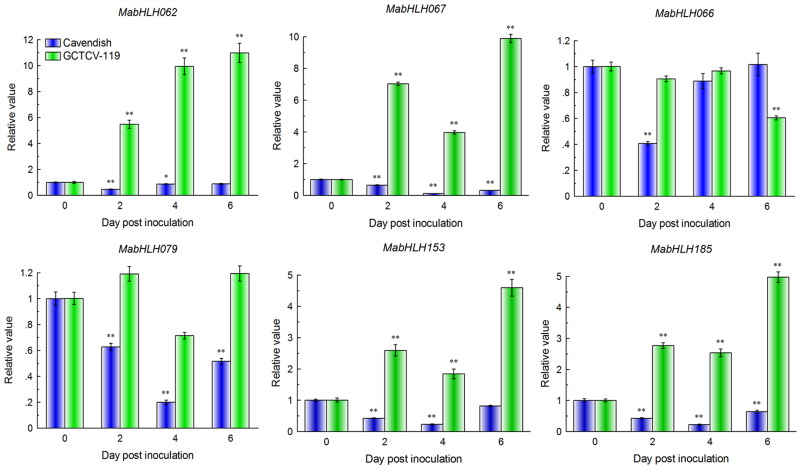
FIGURE 9.
Expression patterns of six MabHLH genes in Cavendish and GCTCV-119 inoculated with Foc TR4 by qRT-PCR. The results are presented as differential relative transcript abundance. The data represent the mean ± standard deviation (SD) of three replicates. The y-axis shows the transcript fold-change relative to that in the control (0 DPI). * and **significantly different from the control (0 DPI) at P < 0.05 and 0.01, respectively.

