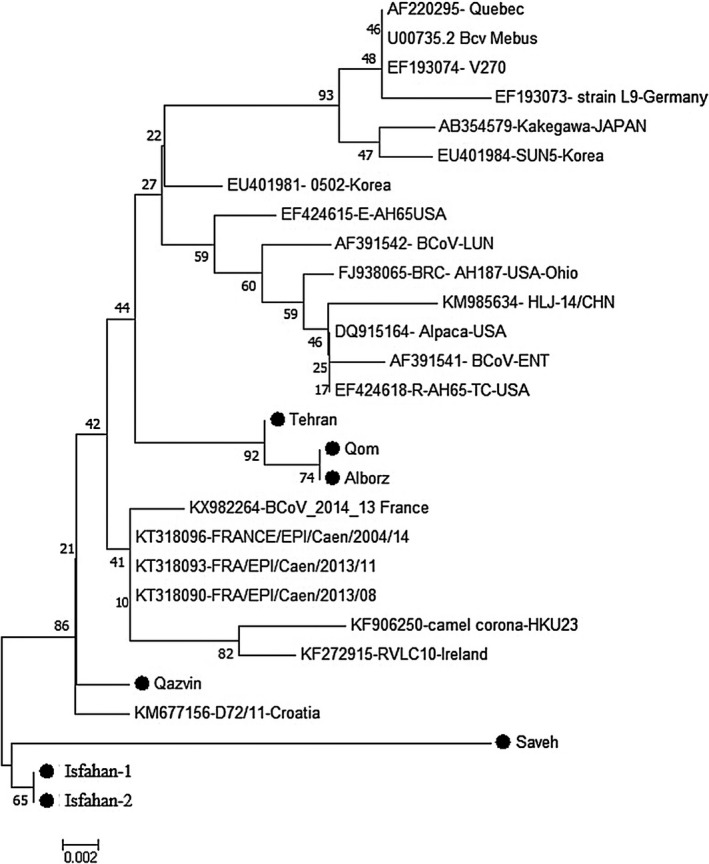
Figure 2.

Evolutionary relationships of taxa, Maximum Likelihood tree based on partial length of the nocleucapsid gene, Isolates from this study are represented by a filled circle (●). The evolutionary history was inferred using the Neighbour‐Joining method. The optimal tree with the sum of branch length = 0.13257831 is shown. The percentage of replicate trees in which the associated taxa clustered together in the bootstrap test (1,000 replicates) are shown next to the branches
