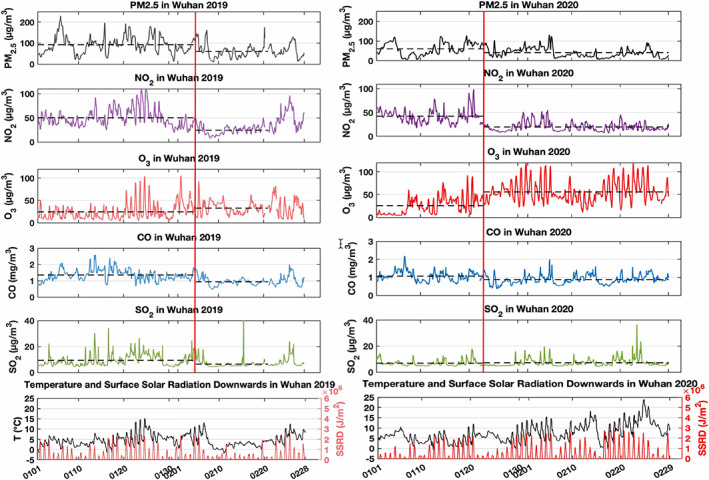
Figure 1.

Left panel: Evolution of the mean concentration of PM2.5, NO2, O3, CO, and SO2 (all in μg m−3 except in mg m−3 for CO) recorded by the monitoring stations in the urban area of Wuhan from 1 January 2019 to 28 February 2019. The vertical red line corresponds to the beginning of the Spring Festival on 5 February 2019. The horizontal dash lines indicate the averages of the quantities before and after this date. Right panel: Same as on the left panel, but for the period 1 January 2020 to 29 February 2020. The red vertical line indicates the day (23 January 2020) during which the lockdown of Wuhan was implemented by the Chinese authorities. The horizontal dash lines show the mean of the represented quantities before and after this date. The data of temperature and surface solar radiation downwards (SSRD) are from the Copernicus Climate Change Service (C3S) (n.d.).
