
Figure 2.
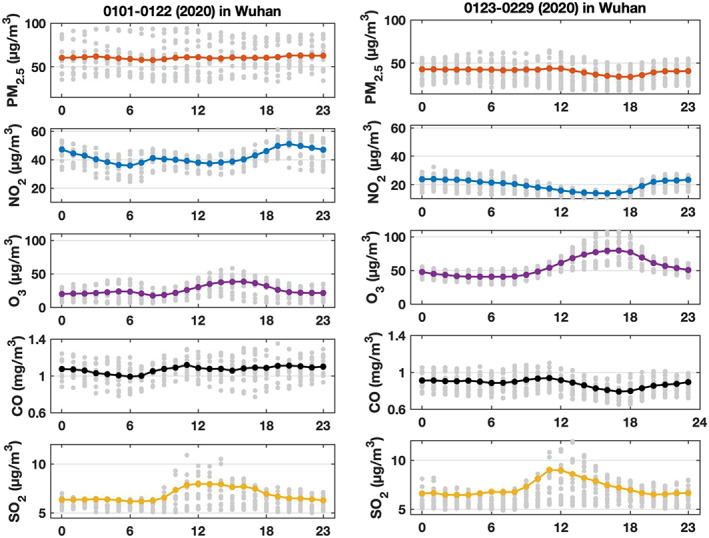
Average diurnal variation of the PM2.5, NO2, O3, CO, and SO2 concentrations (in μg m−3 except CO in mg m−3) recorded in the urban area of Wuhan: Values are for the period 1–22 January 2020 (left) and for the period 23 January to 29 February 2020 (right). The range of gray dots range from 25th percentile and 75th percentile of daily values at each hour in the specified period, averaged over all monitoring stations.