Figure 3.

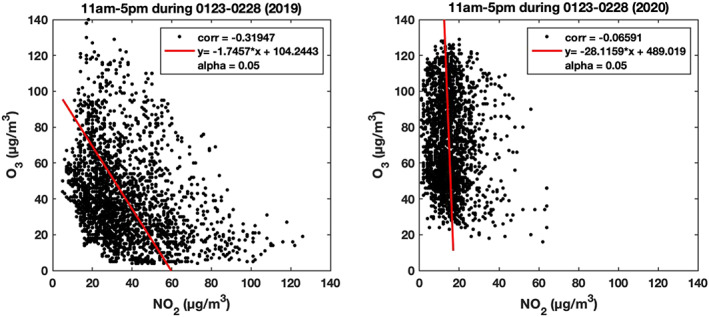
Scatterplot representing daytime ozone (11 am to 5 pm) measured at Wuhan as a function of measured nitrogen dioxide between 23 January and 28 February in 2019 (left panel) and during the same period in 2020 (right panel).

Scatterplot representing daytime ozone (11 am to 5 pm) measured at Wuhan as a function of measured nitrogen dioxide between 23 January and 28 February in 2019 (left panel) and during the same period in 2020 (right panel).