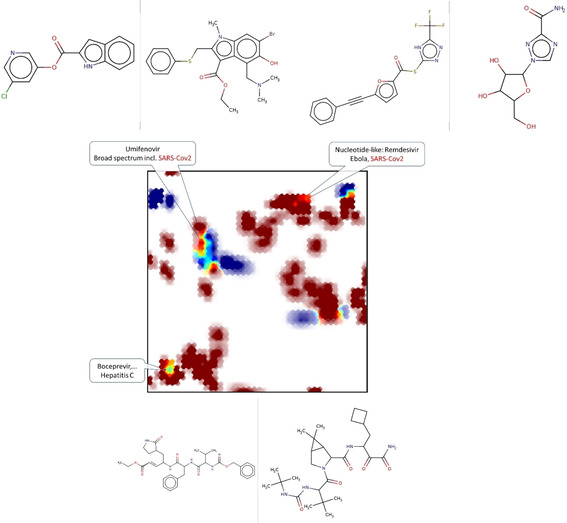
Figure 4.

Projection (UM#1) of active (<10 μM) inhibitors of SARS‐CoV 3CL proteinase (blue) against the background of DrugBank compounds. Representative structures (protease inhibitor: left/DrugBank reference: right) are shown next to the key map zones with overlap.
