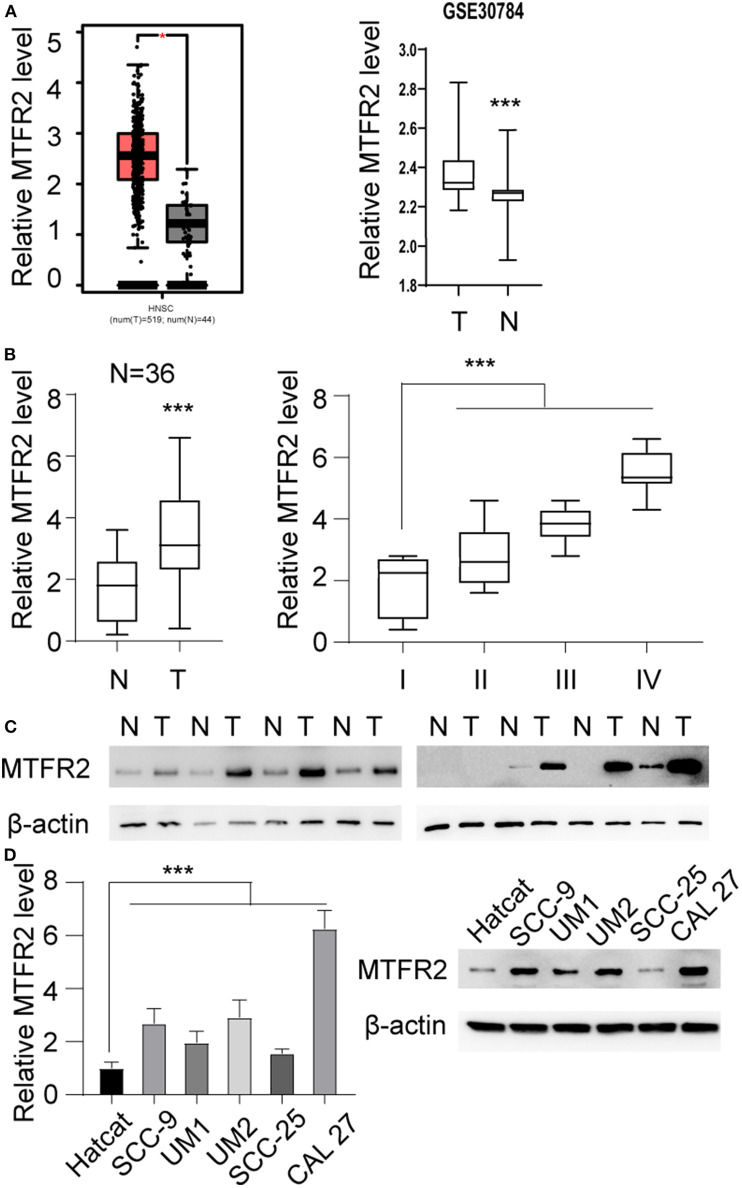
Figure 1.
MTFR2 was upregulated in OSCC. (A) Left, the relative MTFR2 level in TCGA database, *p < 0.05 right, the relative MTFR2 level in GSE 30,784 database, ***p < 0.001. (B) Left, the relative MTFR2 level of in-house database, ***p < 0.001 right, the relative MTFR2 level in patients with different stage, ***p < 0.001. (C) The western blot of MTFR2 in 8 tumor and paired normal tissue. (D) Left, the relative MTFR2 level in OSCC cell line, ***p < 0.001. Right, the western blot of MTFR2 of OSCC cell line.

