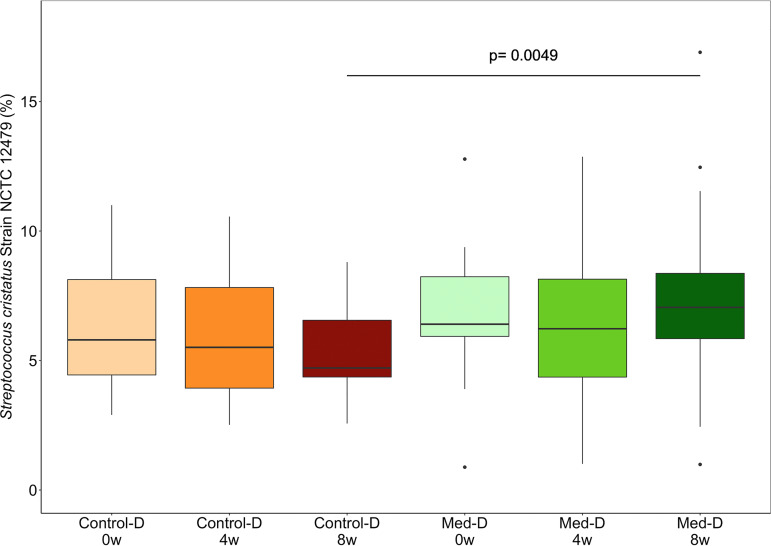
FIG 4.
Box plot showing the relative abundances of Streptococcus cristatus oligotypes in the categories analyzed in this study. Subjects belonging to different categories were colored according to diet and time points (see the legend to Fig. 1 for details).

