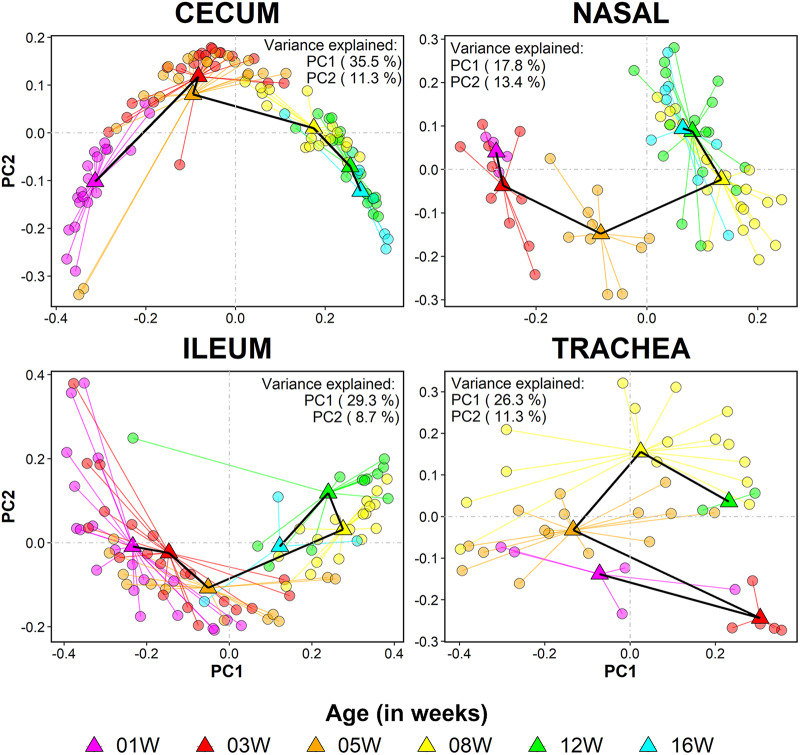
FIG 3.
Community composition of samples from each body site changes gradually with host age. Principal coordinate plot of sample distribution, given according to unweighted UniFrac distances. Samples (circles) are colored according to age at sampling: 1 week (pink), 3 weeks (red), 5 weeks (orange), 8 weeks (yellow), 12 weeks (green), and 16 weeks (blue). The black line connects the centroids of consecutive age groups. Only the first two axes are given for each plot. Variance explained by each axis is given in the corner of each plot.

