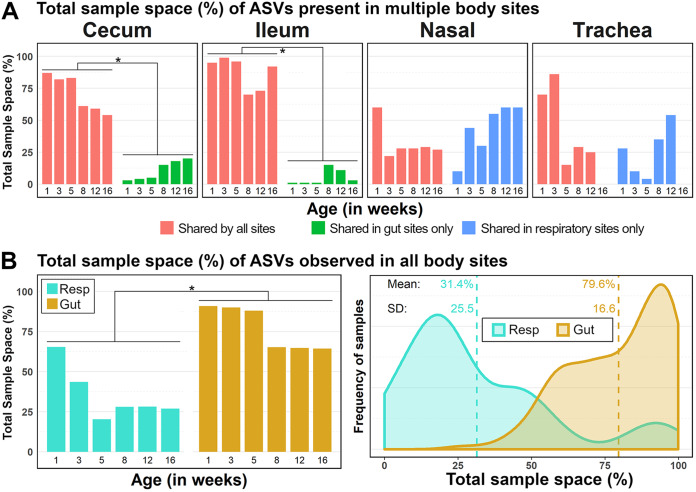
FIG 4.
Total sample space (per age group) occupied by ASVs that are shared by all sites (red; 285/1,874 ASVs), shared by sites in the respiratory tract only (blue; 133/1,874 ASVs), and shared by sites in the gut only (green; 506/1,874 ASVs). Percentages given are the mean total relative abundance of shared ASVs in a body site at a particular sampling age. Paired t tests were performed between the mean total abundance of ASV groups per age in a pairwise fashion with Bonferroni correction for multiple comparisons between ASV groups in a body site (A) and between the respiratory tract and gut (B, left). Asterisks indicate significant differences between ASV groups (P < 0.05). (B, right) The distribution of sample values for total sample space occupied by ubiquitous ASVs is also shown to demonstrate the distinction in respiratory and gut occupancy by these ASVs at the sample level. A Venn diagram of ASV distribution among samples is given in Fig. S5.

