
FIGURE 1.
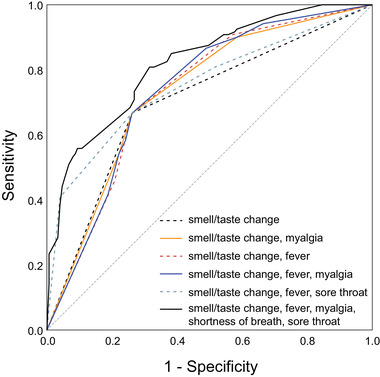
ROC curve plots for symptom classifier models. The dashed diagonal line shows a nondiagnostic result. AUC for each symptom classifier group is displayed in Table 5. AUC = area under the ROC curve; ROC = receiver operating characteristic.
Official websites use .gov
A
.gov website belongs to an official
government organization in the United States.
Secure .gov websites use HTTPS
A lock (
) or https:// means you've safely
connected to the .gov website. Share sensitive
information only on official, secure websites.
ROC curve plots for symptom classifier models. The dashed diagonal line shows a nondiagnostic result. AUC for each symptom classifier group is displayed in Table 5. AUC = area under the ROC curve; ROC = receiver operating characteristic.