
Figure 1.
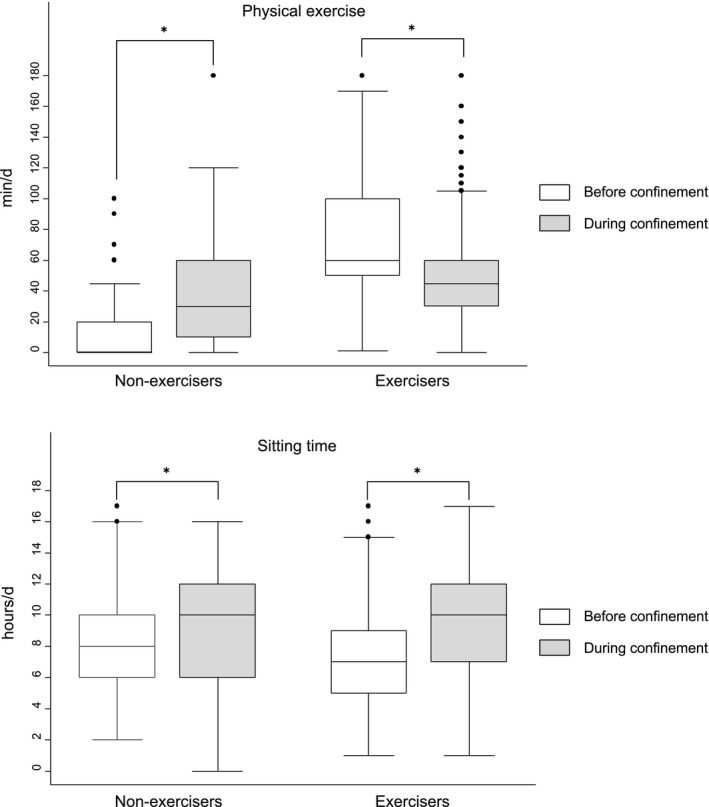
Box plots represent the mean (min/d) in physical exercise (upper image) and the mean (h/min) in sitting time (bottom image) of responders that declared to be non‐regular exercisers (n = 125) and regular exercisers (n = 596) before the confinement and during confinement as a consequence of COVID‐19 disease. *P < .005