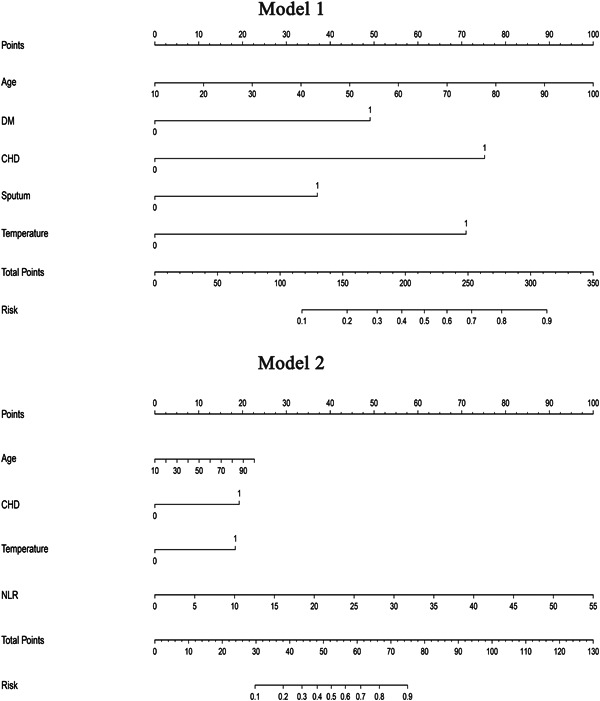
Figure 3.

Nomogram of model 1 and model 2. Values for each variable are individually plotted and correspond to point values assigned from the point scale (top). These point values are then totaled and plotted on the total point scale (bottom), which is used to assign a corresponding value for risk of significant fibrosis. CHD, coronary heart disease; DM, diabetes mellitus; NLR, neutrophil‐to‐lymphocyte ratio
