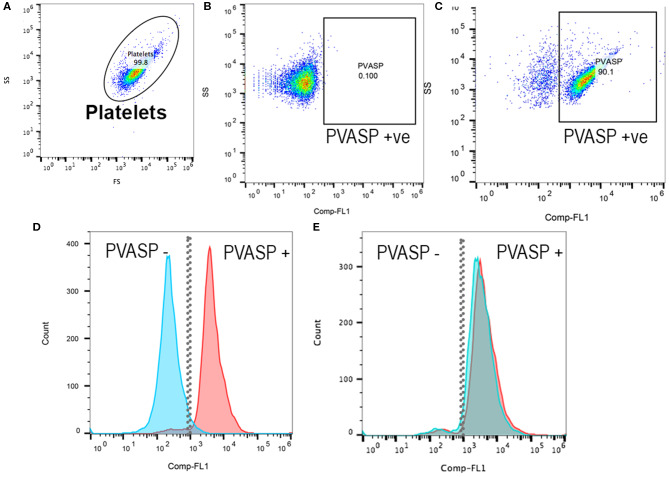
Figure 1.
Representative scatter plot diagrams and histograms of flow cytometric analysis of intraplatelet vasodilator-stimulated phosphoprotein phosphorylation in a cat before and after clopidogrel therapy. (A) Platelets were identified based on their forward (FS) and side scatter (SS) properties. (B) Fluorescent minus one control and isotype control in PGE1-treated platelets were used to determine the P-VASP gate. P-VASP positive platelets were labeled as P-VASP +ve. (C) In PGE1-treated platelets, 90.1% of platelets expressed the phosphorylated form of vasodilator-stimulated phosphoprotein (P-VASP). (D) A histogram illustrating the number of platelets expressing P-VASP in PGE1-treated platelets in presence (Blue) or absence of ADP (Red) prior to clopidogrel therapy. Note that P2Y12 activation by ADP resulted in loss of P-VASP as the population shifts to the left. (E) Following clopidogrel therapy, regardless of ADP activation, PGE1 resulted in VASP phosphorylation due to irreversible inhibition of P2Y12.

