Figure 3.

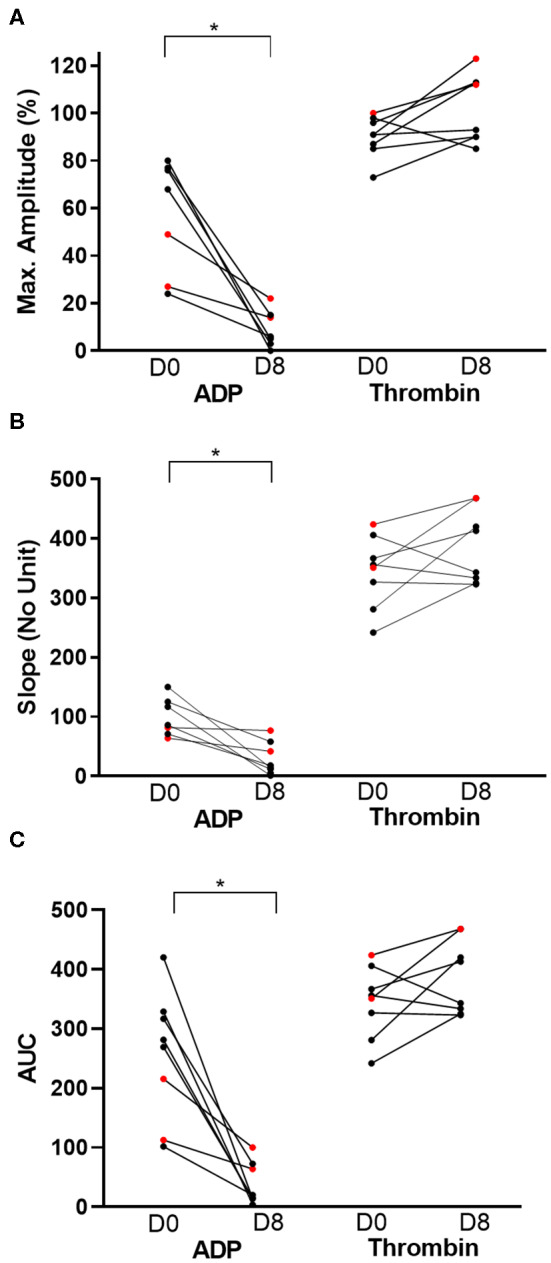
Before-and-after dot plots of light transmission aggregometry from eight cats before and after 7 days of clopidogrel treatment. ADP or thrombin-induced platelet aggregometry was measured as maximum amplitude (%), slope (no unit) and area under the curve (AUC). Thrombin-induced platelet aggregation served as positive control. ADP-induced aggregation, as measured by percent of maximum amplitude (A), slope (B) and AUC (C), was significantly decreased on day 8 (D8) compared to day 0 (D0). In contrast, thrombin did not result in significant changes in all three measurements on light transmission aggregometry. Red dots represent cats that were resistant to clopidogrel therapy. *p < 0.05.
