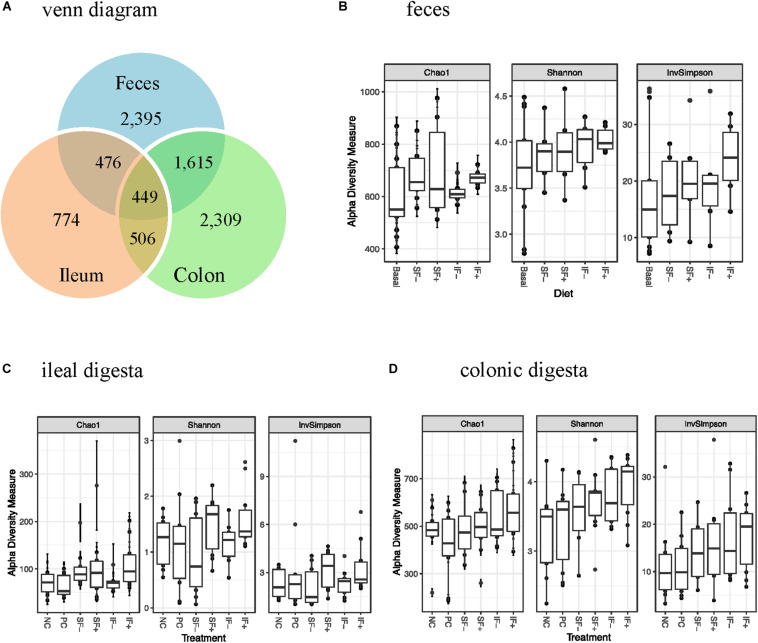
FIGURE 1.
OTUs and alpha-diversity (Chao1 richness, Shannon and InvSimpson diversity indices) of bacterial community of weaned pigs challenged with ETEC. (A) Venn diagram showing the number of OTUs assigned in pre-challenge feces and post-challenge ileal and colonic digesta samples. (B) Alpha diversity in pre-challenge fecal microbiota; Basal: control diet (n = 13); SF-: soluble fiber without carbohydrases (n = 8); SF+: soluble fiber with carbohydrases (n = 6); IF-: insoluble fiber without carbohydrases (n = 6); IF+: insoluble fiber with carbohydrases (n = 6). (C) Alpha diversity in post-challenge ileal microbiota. (D) Alpha diversity in post-challenge colonic microbiota. NC, non-challenged control diet; PC, ETEC-challenged control diet; n = 10 pigs per treatment for ileal and colonic samples.

