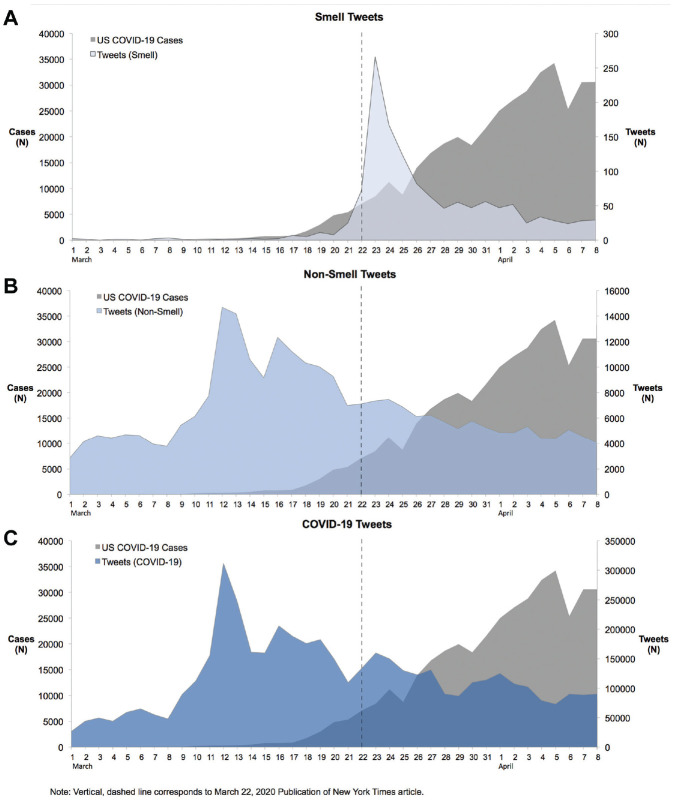
Figure 1.
Frequency curves of coronavirus disease 2019 (COVID-19) incidence in the United States and tweets concerning (A) loss of smell, (B) nonsmell symptoms, and (C) COVID-19. The vertical line represents the date of lay article linking anosmia with COVID-19. Vertical, dashed line corresponds to March 22, 2020, publication of New York Times article.

