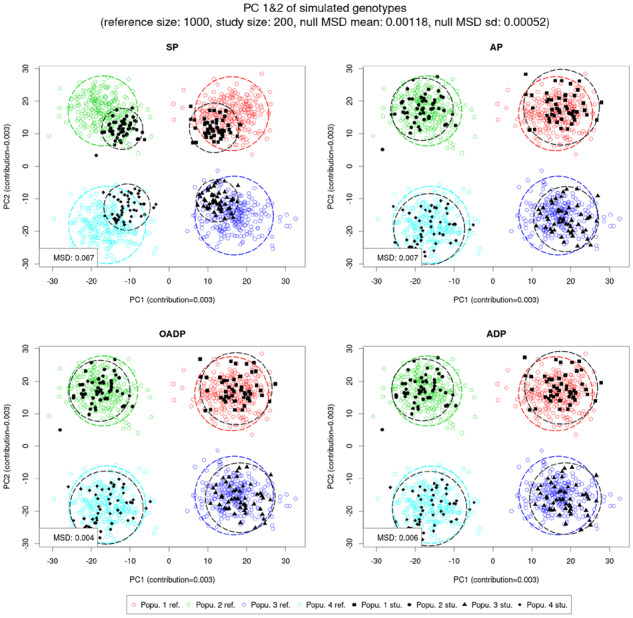
Fig. 1.

The Top 2 PC scores of the simulated genotypes as predicted by SP, AP, OADP and ADP when the reference size was 1000. In each of the four populations, there were 250 reference samples and 50 study samples, where each sample contained 100 000 variants. The colored/black circle is centered at the reference/study sample mean and encloses 90% of the reference/study samples. The MSD has been scaled with the average distance between the reference population means and the reference global mean. (Color version of this figure is available at Bioinformatics online.)
