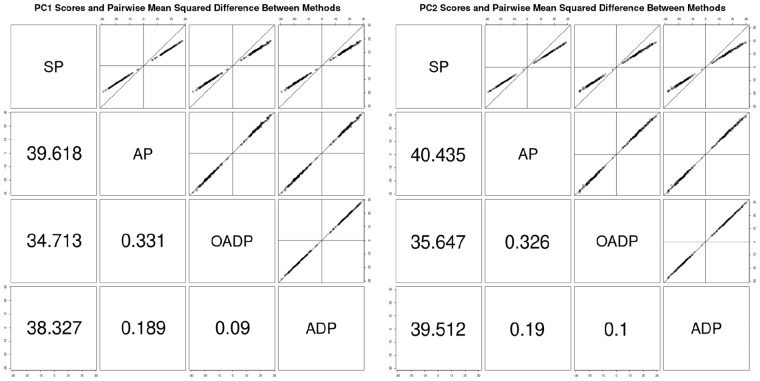
Fig. 2.
Pairwise comparison of the simulated genotype data’s PC1 and PC2 scores as predicted by SP, AP, OADP and ADP. The reference and study sizes were 1000 and 200, respectively. Each sample contained 100 000 variants. The upper panels show the PC scores, while the lower panels show the pairwise mean-squared difference between the methods

