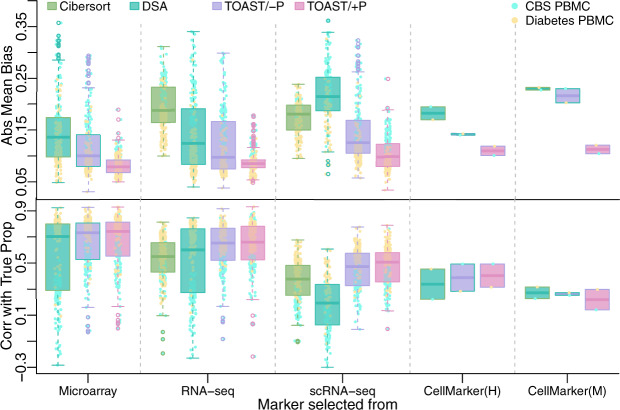
Fig. 3.
Deconvolution performance in two real datasets with markers selected from different sources. From left to right, cell-type-specific markers are selected from microarray, RNA-seq, scRNA-seq immune references, CellMarker (http://biocc.hrbmu.edu.cn/CellMarker/) human immune cell-type markers and mouse immune cell-type markers (mapped to human symbols). Four methods under evaluations are Cibersort, DSA, TOAST/- and TOAST/+P. For the left three columns, Abs Mean Bias and correlation with true proportions are obtained from different combinations of marker number selections (5, 10, 15, 20, 30 and 50), sample size selections (5, 10, 15 and 20 for CBS PBMC data and 5, 10, 20, 30, 50 and 100 for Diabetes PBMC data) and number of wrong markers (0, 1, 2 and 3)

