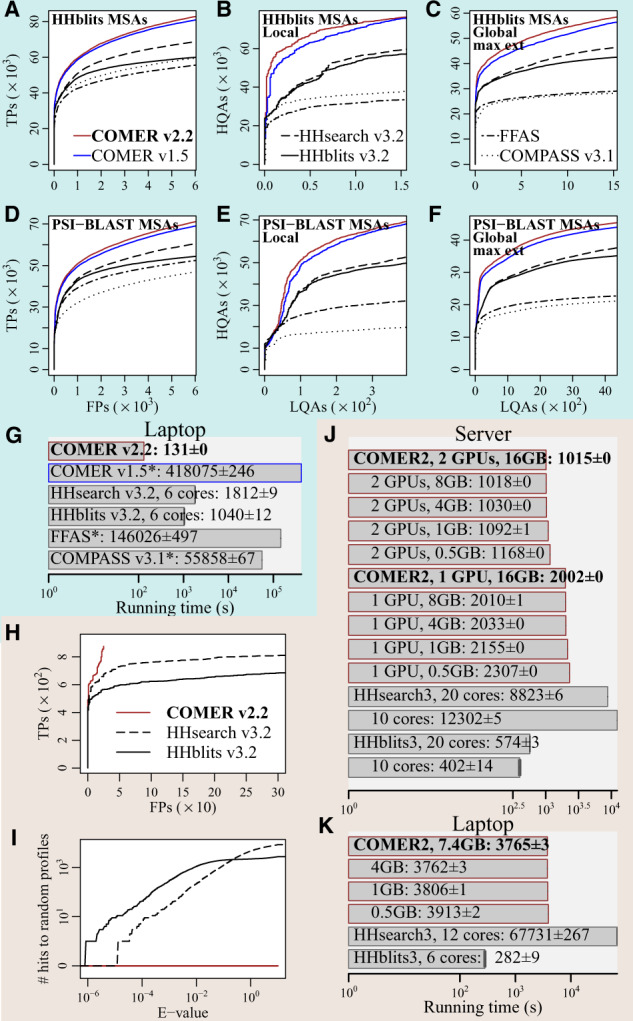
Fig. 1.

Results for (A–G) the SCOPe and (H–K) the simulated dataset. (A, D and H) sensitivity; (B and E) alignment quality in the local mode; (C and F) alignment quality in the global mode. COMER, HHsearch and HHblits maximally extend alignments. (G, J and K) running time; (I) specificity. Bold type denotes the new COMER version. *Measured on a cluster with Intel Xeon CPUs E5-2670 v3
