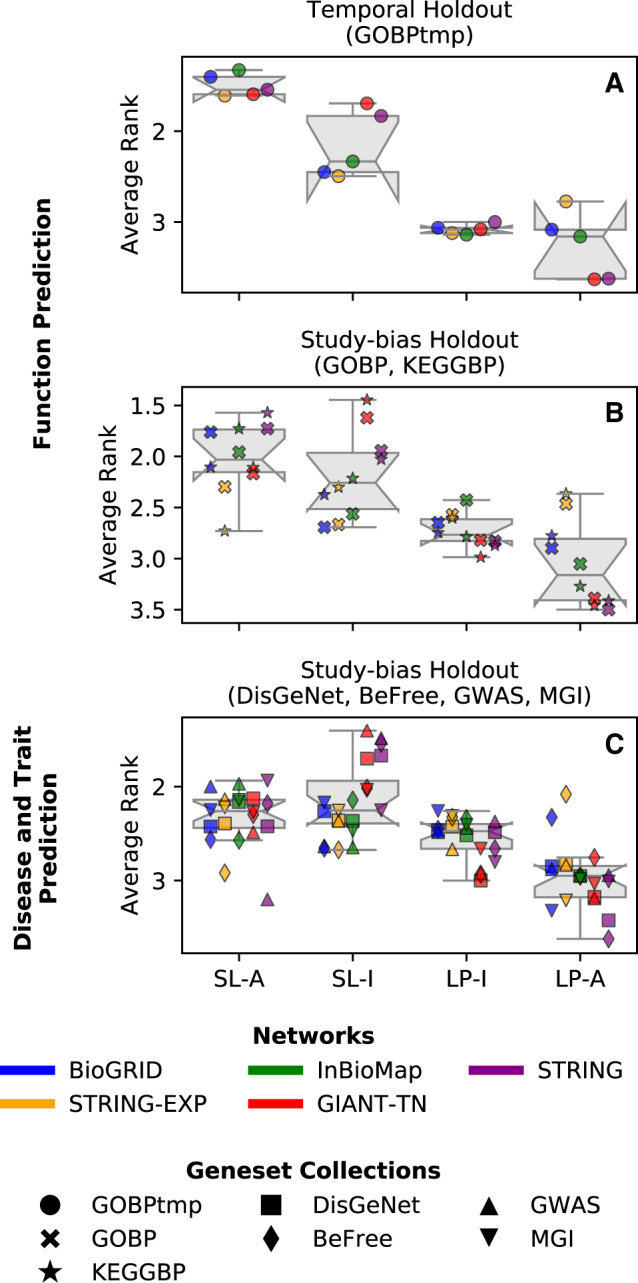
Fig. 2.

Average rank across the four methods. Each point in each boxplot represents the average rank for a geneset-collection–network combination, obtained based on ranking the four methods in terms of performance for each geneset in a geneset-collection using the standard competition ranking. (A) Functional prediction tasks using GOBP temporal holdout, (B) functional prediction tasks using study-bias holdout for GOBP and KEGGBP and (C) disease and trait prediction tasks using study-bias holdout for DisGeNet, BeFree, GWAS and MGI. The results are shown for auPRC where different colors represent different networks and different marker styles represent the different geneset-collections. SL methods outperform LP methods for all prediction tasks
