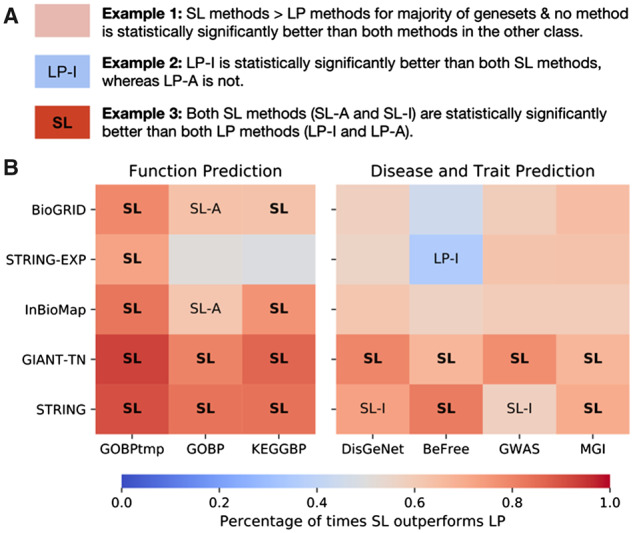
Fig. 3.

Testing for a statistically significant difference between SL and LP methods. (A) A key on interpreting the analysis. For each network–geneset combination, each method is compared to the two methods from the other class (i.e. SL-A versus LP-I, SL-A versus LP-A, SL-I versus LP-I, SL-I versus LP-A). If a method was found to be significantly better than both methods from the other class (Wilcoxon ranked-sum test with an FDR threshold of 0.05), the cell is annotated with that method. If both models in that class were found to be significantly better than the two methods in the other class, the cell is annotated in bold with just the class. The color scale represents the fraction of genesets that were higher for the SL methods across all four comparisons. The first column uses GOBP temporal holdout, whereas the remaining six columns use study-bias holdout. (B) SL methods show a statistically significant improvement over LP methods, especially for function prediction
