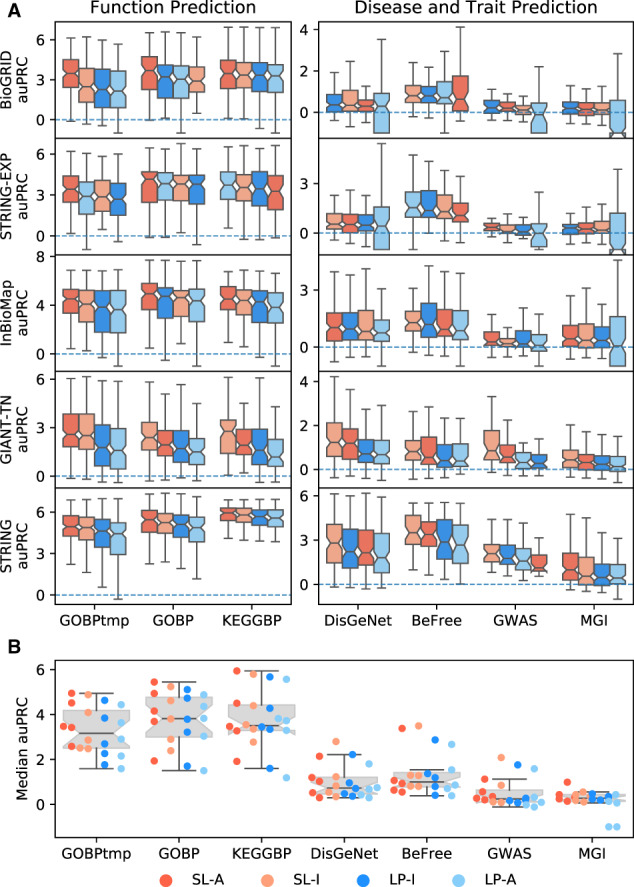
Fig. 4.

Boxplots for performance across all geneset-collection–network combinations. (A)The performance for each individual geneset-collection–network combination is compared across the four methods; SL-A (red), SL-I (light red), LP-I (blue) and LP-A (light blue). The methods are ranked by median value with the highest scoring method on the left. Results show SL methods outperform LP methods, especially for function prediction. (B) Each point in the plot is the median value from one of the boxplots in (A). This shows that both SL and LP methods perform better for function prediction compared to disease/trait prediction. (Color version of this figure is available at Bioinformatics online.)
