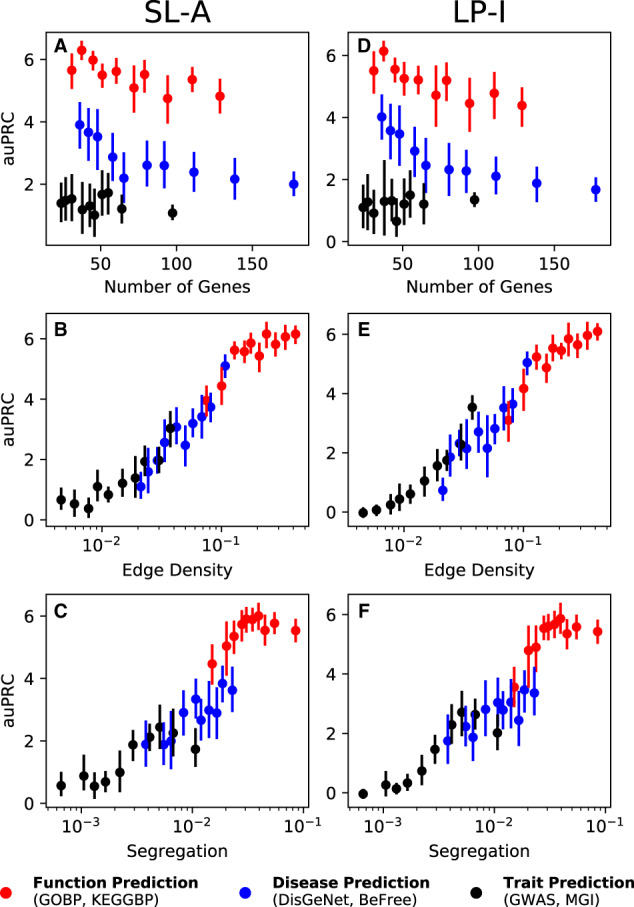
Fig. 5.

Performance versus network/geneset properties. SL-A (A–C) is able to capture network information as efficiently as LP-I (D–F), for the STRING network. There is no correlation between the number of genes in the geneset versus performance (A, D), but there is a strong correlation between the performance and the edge density (B, E) as well as segregation (C, F). The different colored dots represent function genesets (red, GOBP and KEGGBP), disease genesets (blue, DIGenet and BeFree) and trait genesets (black, GWAS and MGI). The vertical line is the 95% confidence interval. Similar trends can be seen for the other networks (Supplementary Fig. S9). (Color version of this figure is available at Bioinformatics online.)
