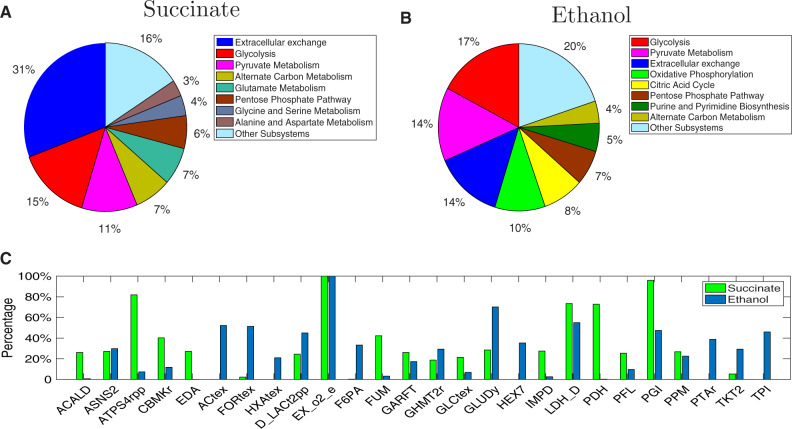
Fig. 4.
Knockout distribution for succinate and ethanol production. (A) The percentage of solutions with at least one knockout from each subsystem for succinate production. (B) The percentage of solutions with at least one knockout from each subsystem for ethanol production. (C) The fraction of design solutions that have a specific knockout (only knockouts with at least a percentage 20% for either target products are displayed)

