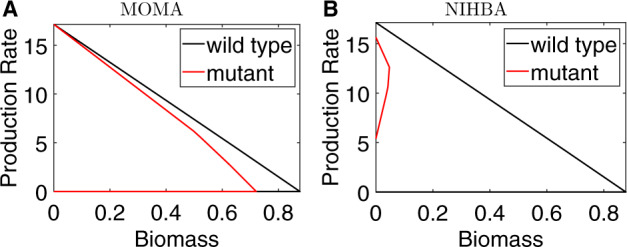
Fig. 6.

Comparison of MOMA and NIHBA in obtaining the best design solutions for succinate production. The plots are production envelopes which illustrate the maximum and minimum guaranteed production rate while varying biomass. Black curves represent the wild-type and coloured curves represent production strains. (A) Production envelope of the best solution identified by MOMA. (B) Production envelope of the best solution identified by NIHBA
