

Abstract
Motivation
Dimension reduction techniques are widely used to interpret high-dimensional biological data. Features learned from these methods are used to discover both technical artifacts and novel biological phenomena. Such feature discovery is critically importent in analysis of large single-cell datasets, where lack of a ground truth limits validation and interpretation. Transfer learning (TL) can be used to relate the features learned from one source dataset to a new target dataset to perform biologically driven validation by evaluating their use in or association with additional sample annotations in that independent target dataset.
Results
We developed an R/Bioconductor package, projectR, to perform TL for analyses of genomics data via TL of clustering, correlation and factorization methods. We then demonstrate the utility TL for integrated data analysis with an example for spatial single-cell analysis.
Availability and implementation
projectR is available on Bioconductor and at https://github.com/genesofeve/projectR.
Contact
gsteinobrien@jhmi.edu or ejfertig@jhmi.edu
Supplementary information
Supplementary data are available at Bioinformatics online.
1 Introduction
Dimension reduction plays a key role in biological discovery from high-dimensional genomics datasets. Lower-dimensional spaces learned represent both biological information and technical artifacts. Thus, it is crucial to interpret and validate these spaces. Independent datasets from related but varied biological contexts, such as different data modalities of equivalent samples or data from the same tissue in related organisms, can be used for interpretation and validation as only the biological effects, and not the technical effects, will be shared. Thus, we can use transfer learning (TL), a sub-domain of machine learning, for in silico validation, interpretation and exploration of these spaces using independent but related datasets across measurement technologies, tissues and species (Stein-O’Brien et al., 2019; Taroni et al., 2019). Furthermore, once the robustness of biological signal is established, these TL approaches can be used for multimodal data integration (Stuart et al., 2019). Here, we present the projectR package to perform TL for multiple unsupervised dimension reduction techniques for genomics analysis.
2 Materials and methods
The projectR package performs TL from the outputs of PCA (principal component analysis), NMF (non-negative matrix factorization), regression, K-means, hierarchical clustering and correlation via the main function of the package—projectR. The inputs to projectR are target data and learned gene features. To learn a common feature mapping, two datasets can be input into the geneMatchR function which will return the datasets separately or jointly, if merge is true, with only common rows—this is automatically done when calling projectR. The loadings argument in projectR corresponds to features for spaces learned by PCA, NMF, regression, K-means and hierarchical clustering and correlation, respectively (Meng et al., 2016). projectR returns a matrix with sample weights for each input basis in the loadings matrix with the option to include P-values (Wald-test and/or bootstrap, Supplementary Files 1 and 5). It is important to note that projection is a bijection, thus, it is possible to use a given dataset as either target or source provided the necessary latent space as already been learned from it. To facilitate TL further, additional functions are provided to operate on the output of projectR. Example uses include, the aucMat function which identifies patterns predictive of given sample annotations using the performance and prediction function from the ROCR package and the alluvialMat function which generates an alluvial plot using the target samples weights to link projected patterns to target annotations. To visualize the projected pattern, we have provided getUMAP and getTSNE functions in the package.
To demonstrate the application of projectR in spatial single-cell analysis we used scRNAseq data from 1297 cells with ≥12 500 unique transcripts and expressing more than five genes from development stage 6 Drosophila embryo as source data (Karaiskos et al., 2017). The position of almost all of the fly embryo cells can be specified using the binarized expression from in situ imaging of 84 marker genes (Fowlkes et al., 2008; Karaiskos et al., 2017). The code for this analysis is available at https://github.com/fertigLab/projectRSpatialExample. We validated the patterns by comparing them to spatial patterns given with vISH (virtual in situ hybridization) (https://shiny.mdc-berlin.de/DVEX/) computed by DistMap (Karaiskos et al., 2017).
3 Results
ProjectR perform TL on gene signatures from clustering, PCA, NMF and correlation. It is computationally efficient, taking 8.09 ± 0.51 s on a 16 GB, Intel Core i7-8750H based 64-bit Windows 10 computer for projecting a 20 000 × 1000 target dataset on 20 000 × 100 latent space. It is important to note that this step is independent of learning the latent space which will take additional time. Previously, we demonstrated the ability of this approach to relate molecular signatures learned with a NMF algorithm, CoGAPS (Fertig et al., 2010) across data platforms, tissues and species (Stein-O’Brien et al., 2019). Here, we expand TL in the projectR Bioconductor package for multi-modal data integration using signatures defined from a wider range of techniques.
We demonstrate the application of this software package using TL with CoGAPS to enable spatial single-cell analysis (Supplementary File 4). Following dimension reduction of scRNAseq data from >5000 pooled stage 6 Drosophila embryos using CoGAPS (Fertig et al., 2010), the learned genes signatures or amplitude matrix, was input to projectR as the loadings. Concomitantly, an age-matched set of in situ imaging data for 84 marker genes binarized into a gene-marker by position matrix is input as the target data (see Section 2). The resulting projection yields a pattern by position matrix showing the spatial distribution of the specific pattern(s) learned from scRNA-Seq data (Fig. 1). For example in Figure 1, patterns 13, which corresponds to mesodermal lineage, is restricted to the ventral region of the embryo. To validate spatial distribution of the scRNAseq patterns, top ten genes for each pattern, i.e. Ilp4, twi, Cyp310a1, ventrally-expressed-protein-D for pattern 13, were compared to their vISH distributions (Fowlkes et al., 2008; Karaiskos et al., 2017). While most genes spatial expression was highly correlated (r > 0.9) with a single pattern, a few genes had more modest correlation values (r ∼ 0.6) spread across multiple patterns in line with CoGAPS’ facility to account for gene reuse in the signatures that it learns (Supplementary File 3). We therefore sought to test the robustness of the spatial projections via leave one out cross-validation for each of these genes. High correlations (r > 0.99, Supplementary Fig. S6) of the resulting pattern with the original is indicative of the robustness of latent space representations which leverage information across multiple genes (Cleary et al., 2017; Stein-O’Brien et al., 2019).
Fig. 1.
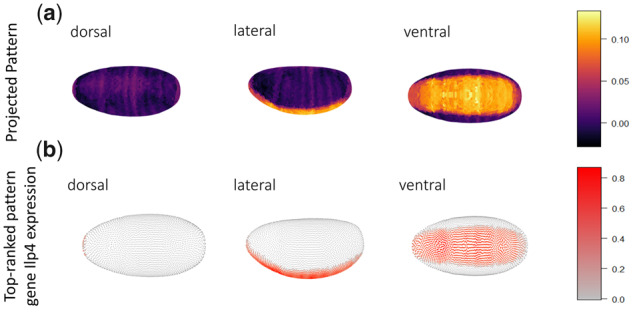
Spatial gene expression patterns identified in Drosophila stage 6 embryo using projectR and CoGAPS. (a) Projected pattern 13 visualized in the dorsal, lateral and ventral regions colored by projected pattern weights. (b) The gene expression of top most gene associated with pattern 13 colored by vISH scores from DistMap
4 Discussion
We have developed projectR as a software package to enable TL dimension reduction of genomics data. Previously, we have shown that application of this technique to patterns learned from NMF relates datasets from different species, data modalities, tissues and measurement platforms (Stein-O’Brien et al., 2019). In this article, we demonstrate its further utility to integrate imaging and single-cell data for spatial transcriptional analysis and expansion to dimension reduction techniques beyond NMF. While similar to Slide-seq, we note projectR expands beyond just a NMF-based regression framework to provide a more general software tool able to implement high spatial resolution of transcriptional data (Rodriques et al., 2019). The software is developed generally to enable pattern validation, discovery and annotation transfer across datasets with a wide range of unsupervised learning techniques. As the efficacy of TL via dimension reduction is dependent on the quality of the learned latent spaces, testing the relative information content transferred by these different techniques we be important to determine for a given use case. While currently limitations of this work preclude the ability to predict individual gene/cell values outside of the context of individual patterns, expansion of this method to this end is an area of active development. Future work applying this tool will enable assessment of biological pattern discovery and integrated analysis of multi-modal genomics data.
Supplementary Material
Acknowledgements
The authors thank Timothy Triche Jr and Thomas Sherman for feedback.
Funding
This work was supported by the NIH (R01CA177669, U01CA196390 and U01CA212007 to E.J.F.); the NSF (IOS-1656592 to L.A.G.); the Chan-Zuckerberg Initiative DAF (2018-183445 to L.A.G. and 2018-183444 to E.J.F.) an advised fund of Silicon Valley Community Foundation; the Johns Hopkins University Provost Fellowship (to G.S.O.-B.), Catalyst (to E.J.F. and L.A.G.) and Discovery awards (to E.J.F.); the Johns Hopkins University School of Medicine Synergy Award (to L.A.G. and E.J.F.); the Allegheny Foundation (to E.J.F.); the Lustgarten Foundation (to E.J.F.); the Emerson Foundation (640183 to E.J.F.); Amazon (to G.S.O.-B.); and the Kavli Institute (to G.S.O.-B.).
Conflict of Interest: none declared.
References
- Cleary B. et al. (2017) Efficient generation of transcriptomic profiles by random composite measurements. Cell, 171, 1424–1436.e18. [DOI] [PMC free article] [PubMed] [Google Scholar]
- Fertig E.J. et al. (2010) CoGAPS: an R/C±+ package to identify patterns and biological process activity in transcriptomic data. Bioinformatics, 26, 2792–2793. [DOI] [PMC free article] [PubMed] [Google Scholar]
- Fowlkes C.C. et al. (2008) A quantitative spatiotemporal atlas of gene expression in the Drosophila blastoderm. Cell, 133, 364–374. [DOI] [PubMed] [Google Scholar]
- Karaiskos N. et al. (2017) The Drosophila embryo at single-cell transcriptome resolution. Science, 358, 194–199. [DOI] [PubMed] [Google Scholar]
- Meng C. et al. (2016) Dimension reduction techniques for the integrative analysis of multi-omics data. Brief. Bioinformatics, 17, 628–641. [DOI] [PMC free article] [PubMed] [Google Scholar]
- Rodriques S.G. et al. (2019) Slide-seq: a scalable technology for measuring genome-wide expression at high spatial resolution. Science, 363, 1463–1467. [DOI] [PMC free article] [PubMed] [Google Scholar]
- Stein-O’Brien G.L. et al. (2019) Decomposing cell identity for transfer learning across cellular measurements, platforms, tissues, and species. Cell Syst., 8, 395–411.e8. [DOI] [PMC free article] [PubMed] [Google Scholar]
- Stuart T. et al. (2019) Comprehensive integration of single-cell data. Cell, 177, 1888–1902.e21. [DOI] [PMC free article] [PubMed] [Google Scholar]
- Taroni J.N. et al. (2019) Multiplier: a transfer learning framework for transcriptomics reveals systemic features of rare disease. Cell Syst., 8, 380–394.e4. [DOI] [PMC free article] [PubMed] [Google Scholar]
Associated Data
This section collects any data citations, data availability statements, or supplementary materials included in this article.