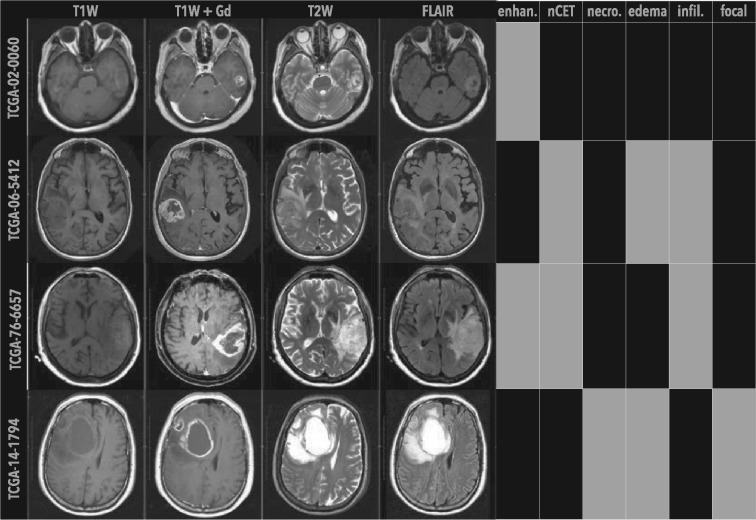
Fig. 1.
Examples of phenotypic differences observed in GBM patients. Shown are single, axial images of pre-op MRI scans from the TCGA–GBM cohort. Four MRI sequences were used to annotate tumor (white arrows) imaging traits: T1W, T1W+Gd and T2W and FLAIR images. MRI traits included enhancing (enhan.), nCET, necrosis (necro.), edema, infiltrative (infil.) and focal, where class labels were indicated by black (proportions , expansive, or focal) or gray (proportions , infiltrative, or non-focal) blocks

