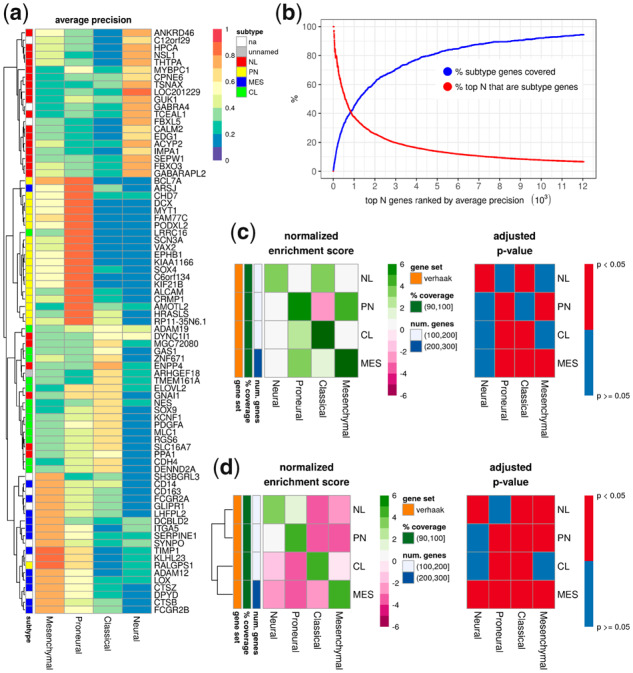
Fig. 6.

Single gene masking in the subtype model: (a) the top 20 genes used to predict each subtype; (b) the percent of subtype genes covered in the top N genes; and (c) GSEA with genes ranked by AP, where positive enrichment indicated the subtype gene set was correlated with high AP and vice versa. (d) An alternative GSEA was performed by ranking genes based on their correlation with a subtype, where positive enrichment indicated the subtype gene set was correlated with a subtype and vice versa. na, not a part of the subtype genes; unnamed, a part of the subtype genes, but not tied to a single subtype
