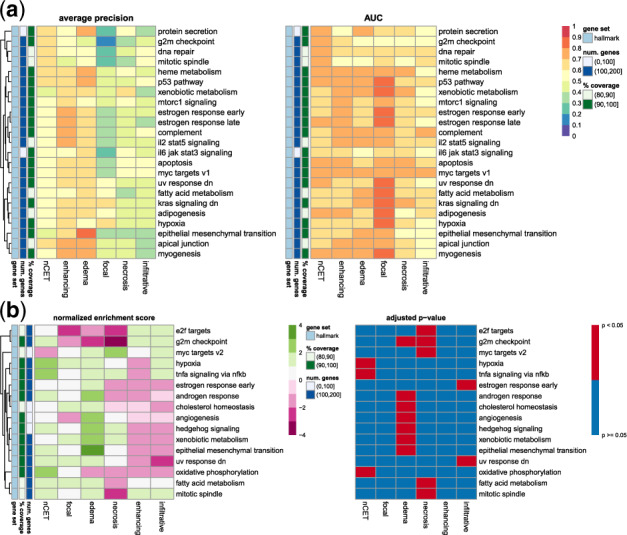
Fig. 7.

Gene masking of the radiogenomic models with the MSigDB hallmark gene sets. (a) Model performance in gene set masking. Shown are the top five gene sets ranked by AP in each MRI trait (see also Supplementary Fig. S9). (b) Enrichment among genes ranked by AP in single gene masking. Positive enrichment indicated gene sets were predictive of an MRI trait and negative enrichment indicated the opposite. Shown are hallmarks with at least one significant enrichment
