
Fig. 8.
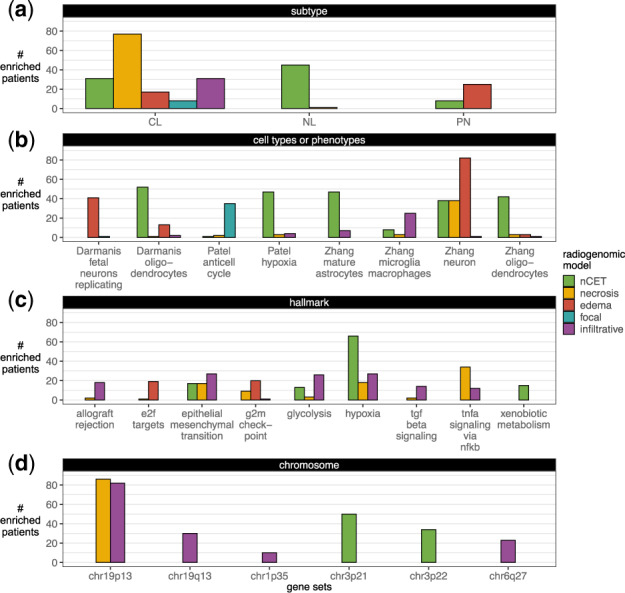
Radiogenomic traits. In gene saliency, each patient’s genes were considered enriched for a gene set at an adjusted P-value of <0.05. (a) Subtype (Verhaak et al., 2010), (b) cell types or phenotypes (Darmanis et al., 2015; Patel et al., 2014; Zhang et al., 2016) and MSigDB’s (c) hallmark and (d) chromosome gene sets with at least ten enriched patients are shown. For more gene saliency results (see Supplementary Fig. S26)