FIG 2.

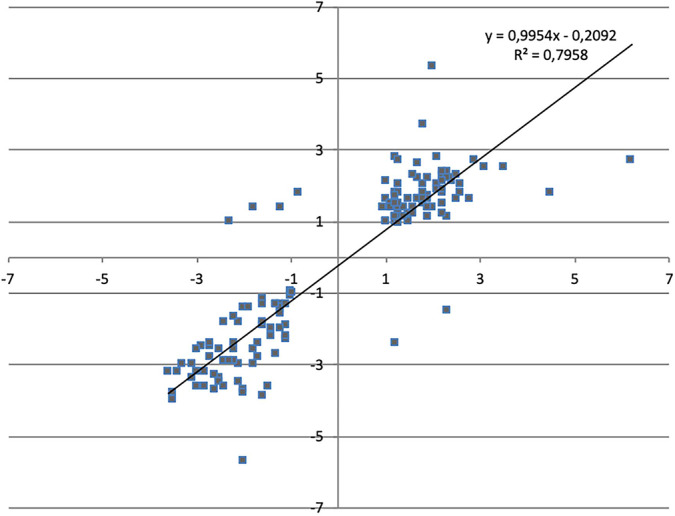
Comparison of the Log fold change (LogFC) values between S. Typhimurium SL1344 exposed to chlorpromazine or PaβN for each significantly transcribed gene. A Pearson’s correlation was used to determine the R2 value.

Comparison of the Log fold change (LogFC) values between S. Typhimurium SL1344 exposed to chlorpromazine or PaβN for each significantly transcribed gene. A Pearson’s correlation was used to determine the R2 value.