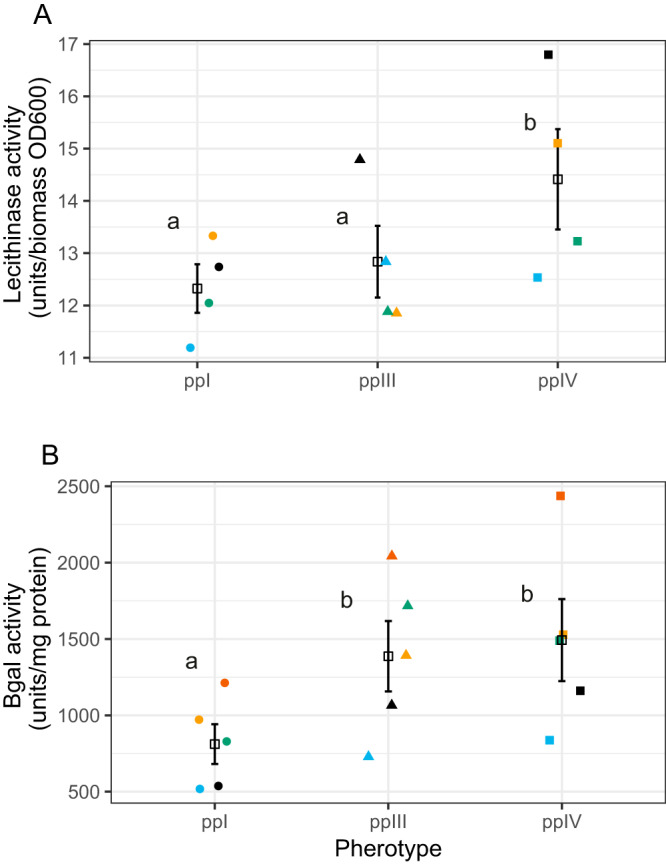
FIG 2.

Variation in PlcR activity in near-isogenic mutants with different pherotypes. This activity was determined in two different independent assays by measuring the activity of a PlcR/PapR-regulated gene product or of a PlcR/PapR-dependent promoter. (A) Peak lecithinase activity square root-transformed, and (B) peak β-galactosidase activity. Data are independent repeats, color coded by block; open squares and error bars are means ± SE. Different letters indicate significant differences in post hoc treatment contrasts. In this and all subsequent figures, ppI, ppIII, and ppIV indicate the pherotype I, III, and IV constructs expressed in a common genetic background.
