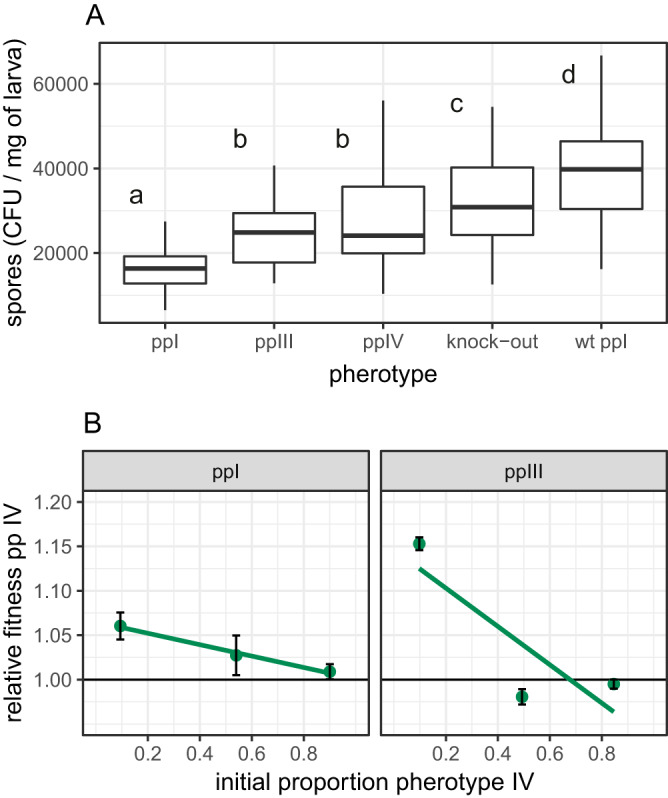
FIG 3.

Variation in total reproduction and of the relative fitness of B. thuringiensis pherotypes in homogenized insects. (A) Variation in final population size in numbers of spores per unit weight of insects between three pherotypes; boxplots with different letters indicate pherotypes that are significantly different in post hoc treatment contrasts; wt ppI indicates strain B. thuringiensis 407 Cry− expressing chromosomally encoded PlcR-PapR belonging to pp I. Boxplots are drawn with default ggplot2 settings and show the median and the first and third quartiles, with the whiskers extending to values no further than 1.5× the interquartile range. (B) Variation in fitness with frequency of competitors in two sets of experiments with different pherotype pairs; data are means ± SE with fitted models for each competition treatment.
