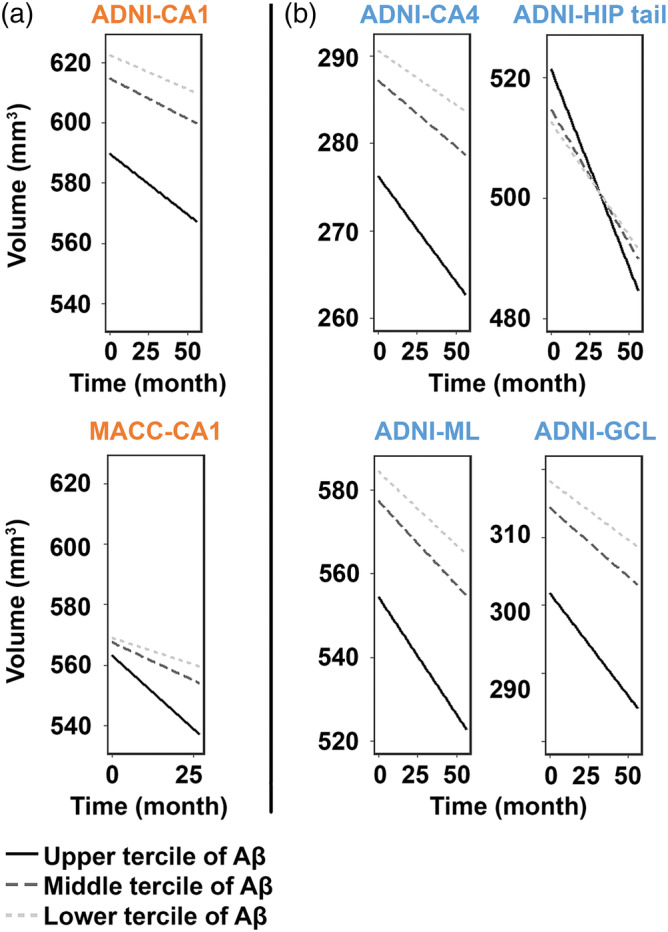
Figure 3.

Faster volume decline in the CA1 with greater Aβ burden in NCI across datasets. Similar between the ADNI dataset and MACC dataset (denoted by orange color), higher level of Aβ was associated with faster atrophy in the CA1 (a). Differently (denoted by blue color), NCI participants in the ADNI dataset also presented faster atrophy in the CA4, HIP tail, ML, and GCL (b). Data were divided into three approximately equal‐sized groups in terms of the log‐transformed SUVR scores, represented by the solid line (upper tercile), dark gray dotted line (middle tercile), and the light gray dotted line (lower tercile). Hippocampal subfields in orange represented overlapping patterns, while those in blue represented distinct patterns between the two datasets. None survived Holm–Bonferroni multiple comparison correction. Abbreviations: GCL, granule cell layer of the dentate gyrus; HIP tail, hippocampal tail; ML, molecular layer; NCI, no cognitive impairment
