
Figure 3.
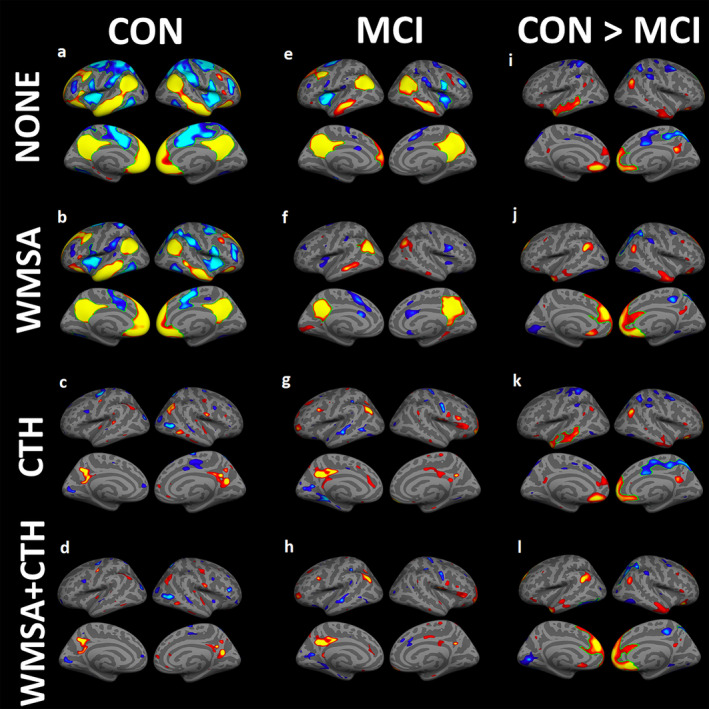
One‐sample group mean (OSGM) functional connectivity maps are shown for (1) cognitively healthy controls (CON): (a) without any regressors, (b) regressing out the effects of white matter signal abnormalities (WMSA) volume only, (c) regressing out cortical thickness (CTH) only, and (d) regressing out both WMSA and CTH. (2) Mild cognitive impairment (MCI) group: (e) without any regressors, (f) regressing out WMSA volume only, (g) regressing out cortical thickness (CTH) only, and (h) regressing out both WMSA and CTH. For the within‐group analyses (a‐h), warm colors indicate significant regional positive correlations with the precuneus‐seed, and cool colors indicate regions of anticorrelation. Between‐group analyses comparing precuneus‐seeded DMN functional connectivity maps between MCI and CON groups: (i) without any regressors, (j) regressing out WMSA only, (k) regressing out CTH only, and (l) regressing out both WMSA and CTH. Warm colors indicate regions of stronger DMN connectivity in CON compared to MCI, whereas cool colors indicate regions where the MCI group showed stronger DMN connectivity compared to the CON group. For all analyses shown, statistical thresholds were set to p < .05, saturation to p < .001, with green outlines indicating regions that survived after multiple comparison correction using a cluster‐wise statistical threshold set to p < .05