
Figure 2.
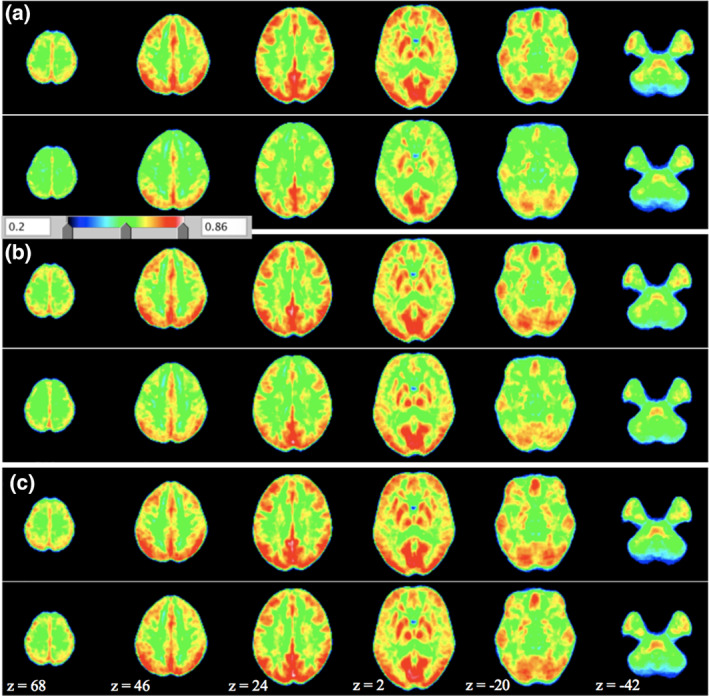
Average ReHo maps for (a) ketamine, (b) midazolam, and (c) placebo condition. In each subplot (a–c), the upper panel shows the pre‐infusion and lower panel shows the postinfusion. Shown are the ReHo maps (with parameters combination of spatial smoothing FWHM, full width at half maximum, 0 mm and cluster size, 27). The z‐coordinates of the displayed axial slices are provided