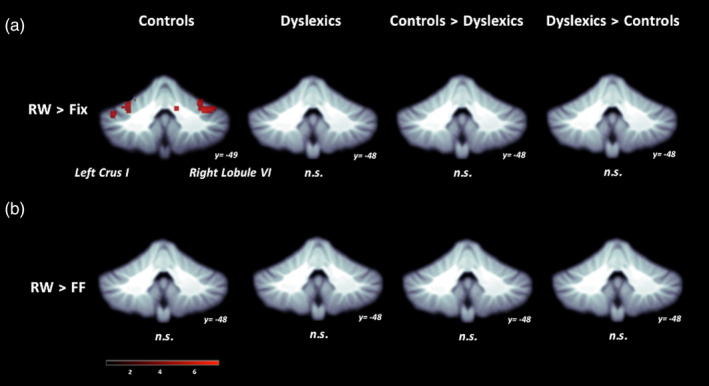
Figure 2.

Cerebellar functional activation maps. (a) Real Word > Fixation and (b) Real Word > False Font contrasts. Significant activation in vermis VI (not shown), left crus I, and right lobule VI in Control group, height threshold p < .001, p < .05 FWE‐corrected. No activation for Real Word > False Font for either group and no between‐group differences for either contrast (A or B)
