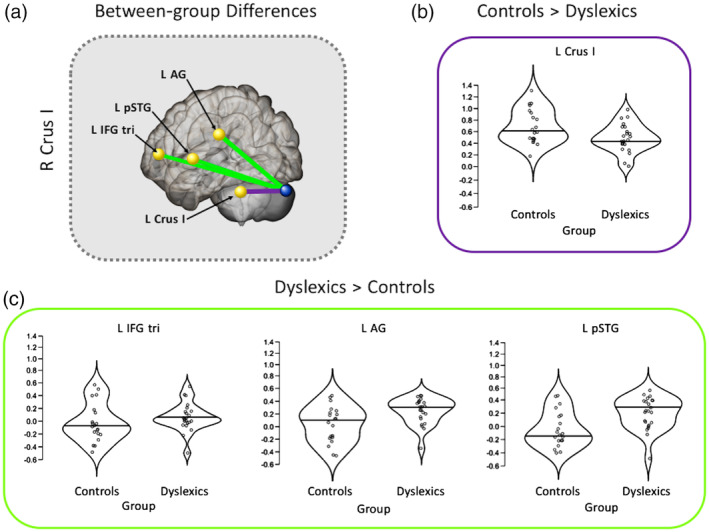
Figure 5.

Background functional connectivity between‐group differences for right crus I examined in more detail. Taken from Figure 4, (a) Between‐group differences, where purple indicates positive FC Controls > Dyslexics and green indicates positive FC dyslexics > controls. Violin plots of z‐scores (y‐axis) for right crus I with (b) left crus I and (c) the three left cortical regions, IFG tri, AG, and pSTG. Black bars represent the mean of z‐score values and circles are z‐scores of individual participants. FC, functional connectivity; IFG, inferior frontal gyrus; pSTG, posterior superior temporal gyrus
