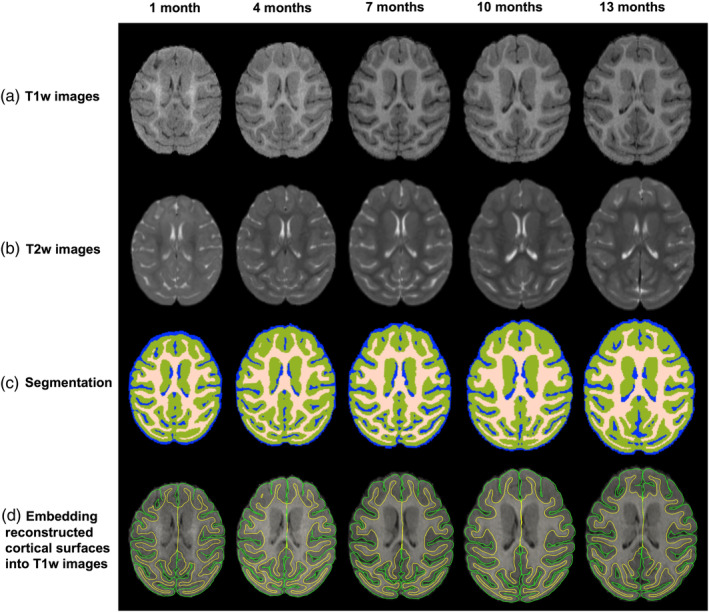
Figure 1.

The segmentation results of a typical subject with five longitudinal scans from 1 month to 13 months. (a) T1w images; (b) T2w images; (c) Tissue segmentation results; (d) Embedding reconstructed cortical surfaces into T1w images. The yellow curves indicate inner surfaces, and the green curves indicate outer surfaces
