
Figure 2.
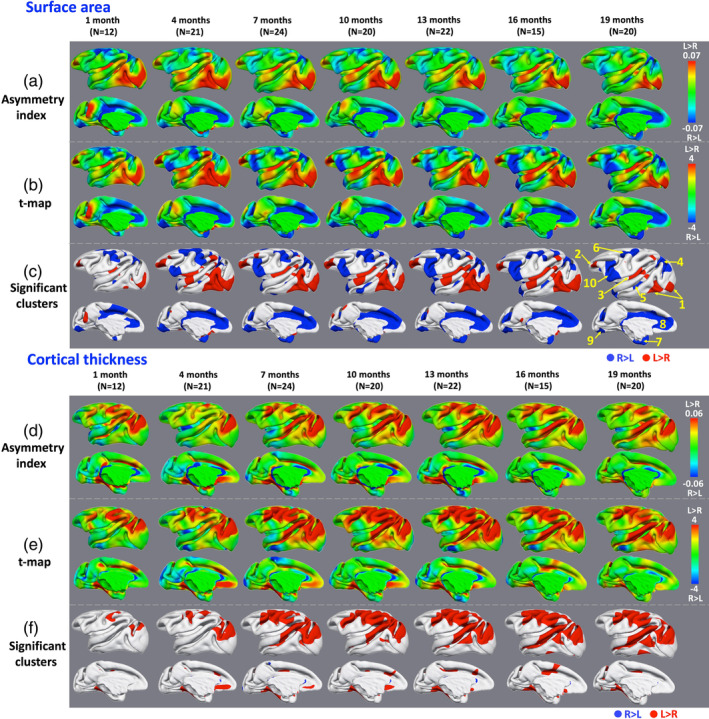
Hemispheric asymmetries of surface area and cortical thickness. (a) and (d): asymmetry index (AI) maps of surface area and cortical thickness, respectively. (b) and (e): Paired t‐maps of left–right values of the surface area and cortical thickness, respectively. (c) and (f): Significant clusters of hemispheric asymmetries of surface area (p < .05) and cortical thickness (p < .05) after correction for multiple comparisons, respectively. Blue clusters indicate rightward asymmetries and red clusters indicate leftward asymmetries