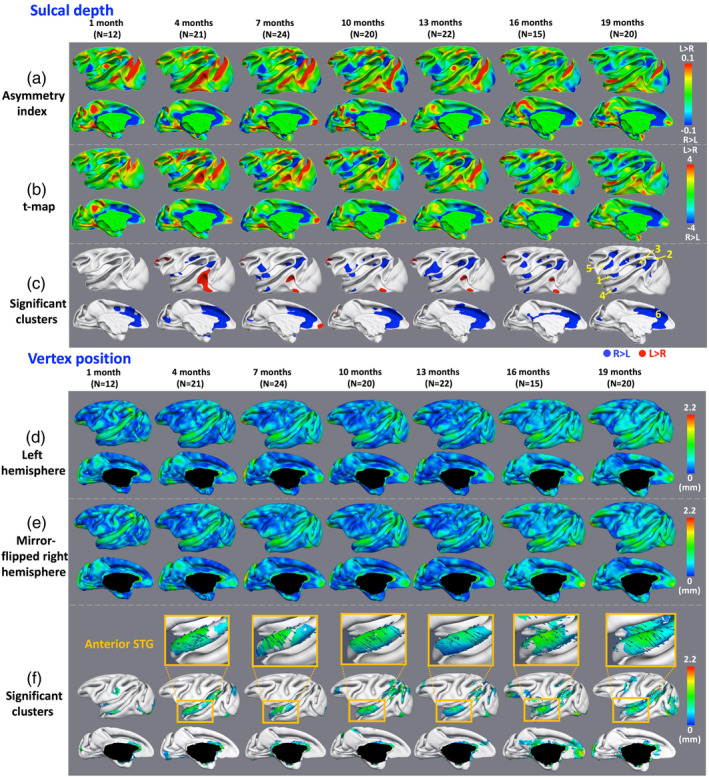
Figure 3.

Hemispheric asymmetries of sulcal depth and vertex position of the cortex. (a) Maps of asymmetry index (AI) of sulcal depth. (b) Paired t‐maps of left–right values of sulcal depth. (c) Significant clusters of hemispheric asymmetries of sulcal depth (p < .05) after correction for multiple comparisons. Blue clusters indicate rightward asymmetries and red clusters indicate leftward asymmetries. (d) and (e) Magnitude maps of the deformation from the left hemispheres to the mirror‐flipped right hemispheres, shown on the age‐matched, left and mirror‐flipped right average central surfaces, respectively. (f) Significant clusters of hemispheric asymmetries of 3D vertex positions between left and mirror‐flipped right hemispheres (p < .05) after correction for multiple comparisons, and the 3D deformation vectors from left to mirror‐flipped right cortical surfaces
