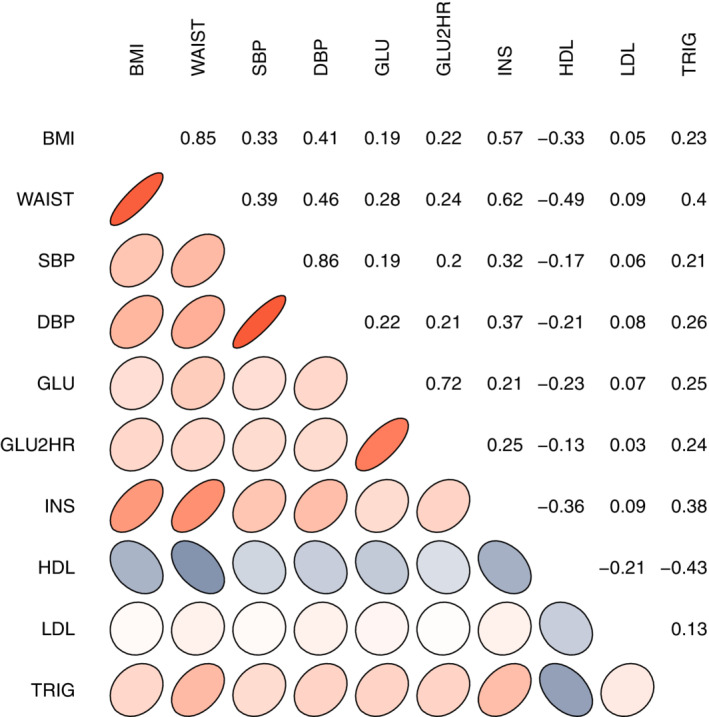
Figure 1.

A summary of the bivariate correlation coefficients between each of the metabolic and vascular risk factors. Ellipse shapes denote the direction of the correlation and numerical values are also provided in each of the corresponding correlation panels. Red color denotes positive correlation, while blue denotes negative correlation. BMI, body mass index; waist, waist circumference; SBP, systolic blood pressure; DBP, diastolic blood pressure; GLU, fasting glucose; GLU2HR, oral glucose tolerance test; INS, insulin; HDL, high‐density lipoprotein; LDL, low‐density lipoprotein; TRIG: triglycerides
